The licence on file, and what is actually moored there.
Each quarter, a polygon layer of every pen, raft and longline visible in your licence area, for you to set against the register.
- GSD
- High / 0.5–2 m
- Cadence
- Quarterly
- Platform
- High-res satellite
- Spectral
- RGB + NIR
The job today
Between boat trips, the register is all you have
The permit file holds a site plan and a set of coordinates. To learn whether the water matches, someone goes out with a handheld GPS, sketches positions on a chart and types them up back at the office.
That works for the licences you can reach. A coastline with a long register can't be visited all at once, so a line that drifted past the boundary or a pen that was added after the application sits there until the next trip.
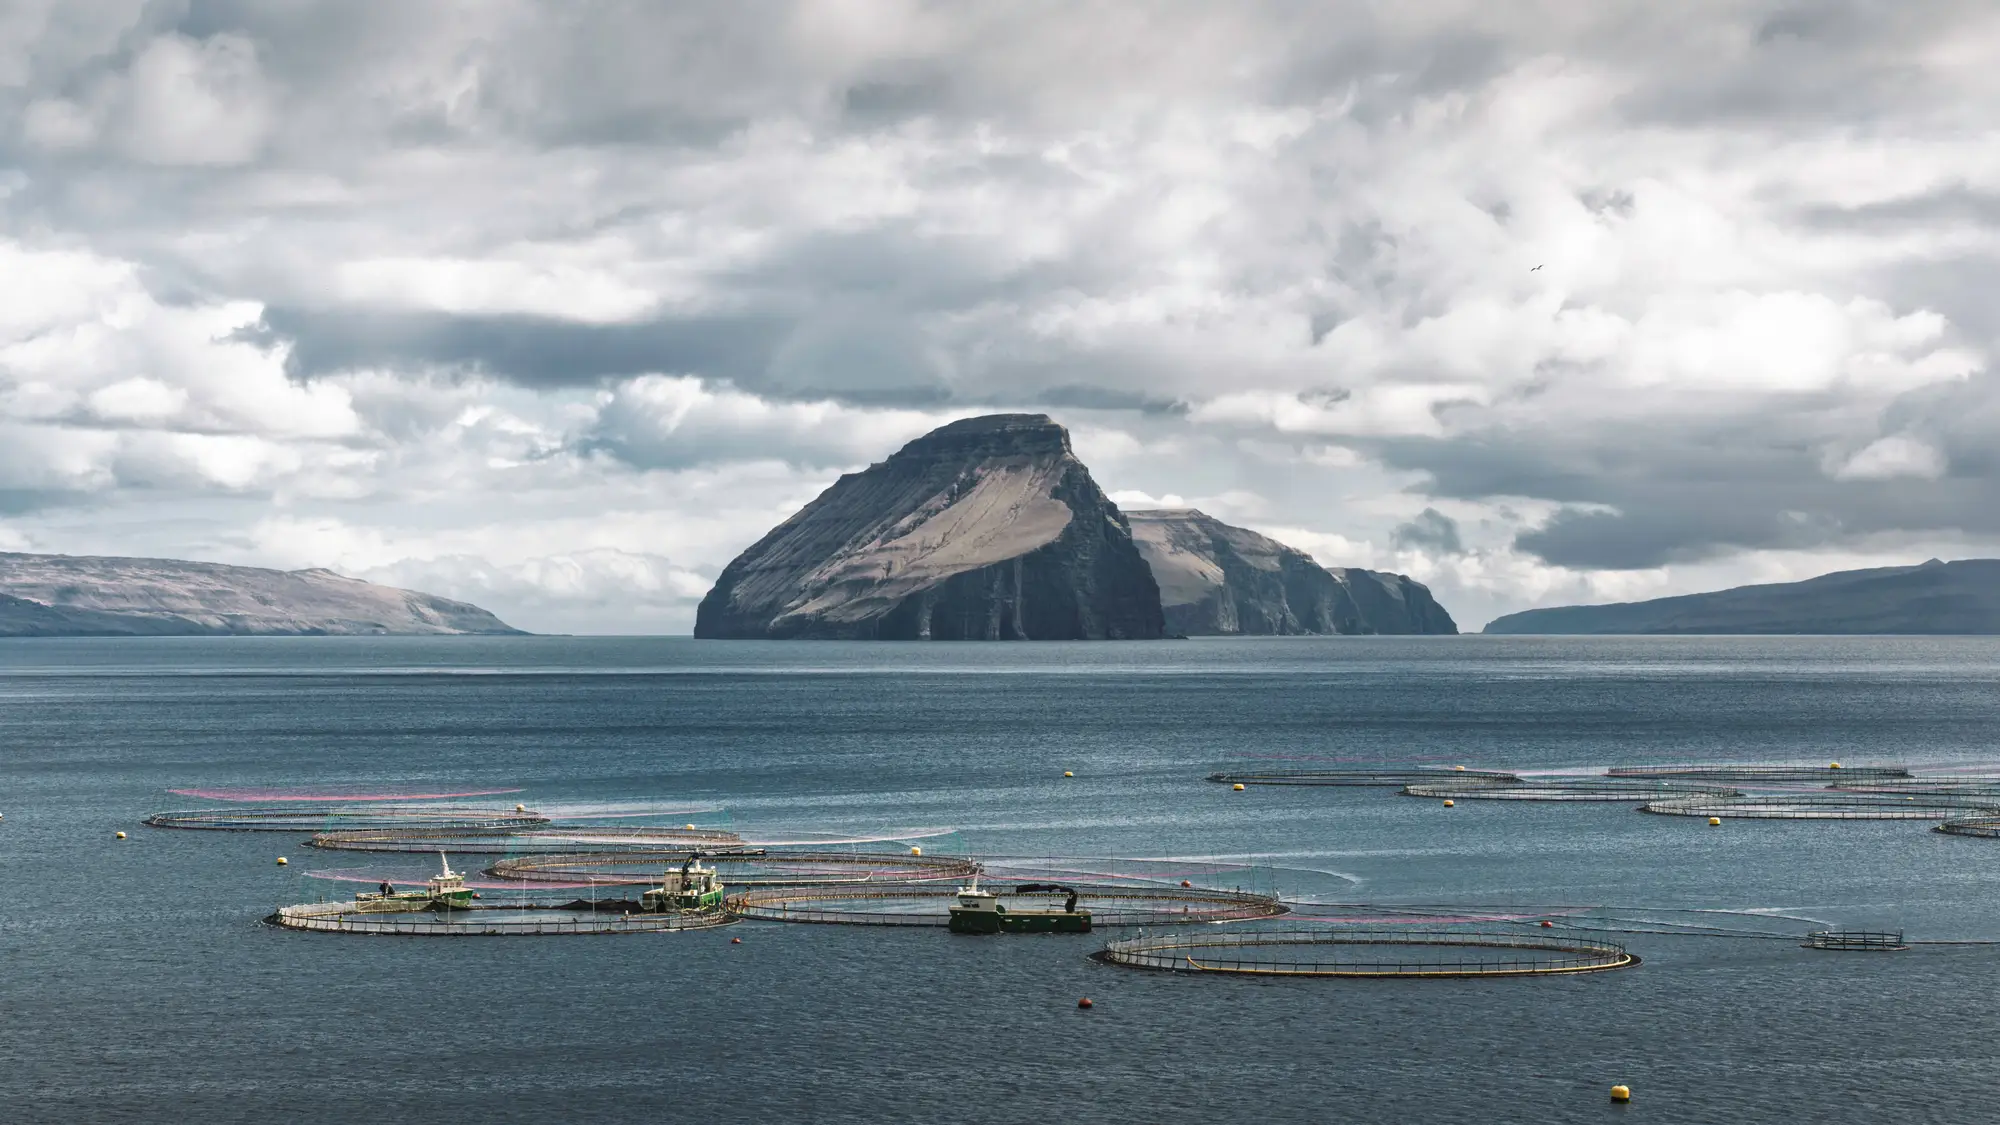
Comparison
Site visit and permit file, against a quarterly footprint layer
01Finding out what is on the water
- Boat trip and paper plan
- A site visit with a boat and a handheld GPS. Positions are sketched on a chart and keyed in at the office.
- With Seafarm Mapping
- Every pen, raft and longline visible from above is traced into a polygon layer for the whole licence area.
- Still yours
- Deciding which licences get a visit.
02Checking against the lease
- Boat trip and paper plan
- Coordinates from the permit file are plotted and compared with the site notes by eye.
- With Seafarm Mapping
- The layer opens in your GIS next to the lease boundaries, so a structure outside the line shows on the screen.
- Still yours
- Judging whether it is a breach and what to do about it.
03Measuring the footprint
- Boat trip and paper plan
- The area comes from the application, which is what the holder declared.
- With Seafarm Mapping
- Each structure carries an area measured from the imagery, to set against the declared figure.
04Preparing a renewal
- Boat trip and paper plan
- A visit is booked ahead of the decision, weather permitting.
- With Seafarm Mapping
- The latest layer goes in the file before anyone leaves the office, and a visit is booked if the footprint calls for one.
05Seeing change between visits
- Boat trip and paper plan
- Nothing is seen until the next trip.
- With Seafarm Mapping
- Each quarter's layer is compared with the last one, flagging structures added, removed or moved.
06Saying what is being farmed
- Boat trip and paper plan
- The inspector on the boat sees the species, the gear and the condition of the site.
- With Seafarm Mapping
- The imagery shows structure type and footprint and nothing else. Species, stocking and husbandry stay with the inspection.
- Still yours
- Everything that needs someone on site.
What you get
What arrives each quarter
GeoJSON or shapefile
Farm polygon layer
One polygon per pen, raft or longline group visible in the licence area, with a structure type attribute. Loads in QGIS or ArcGIS next to your lease boundaries.
attribute on the polygon layer
Area per structure
The footprint measured from the imagery, in hectares or square metres, sitting beside the declared figure from your register where you supply it.
change layer
Quarter-over-quarter comparison
Structures added, removed or moved since the previous pass, flagged on the polygons. The first quarter is the baseline, so the comparison starts with the second.
Through the year
How it works
Before the first pass
You send the licence area or the stretch of coast you regulate, as a boundary file. If you also send your register's boundaries and declared areas, they go into the layer for comparison. We confirm the imagery that is available for that water.
Each quarter
A high-resolution pass with a near-infrared band is taken for the area. A pass too hazy, too glary or too cloudy to read is skipped and the quarter says so, rather than guessing at what is under the haze.
Delivery
The polygon layer and the change flags arrive in a format your GIS opens. A pilot runs for an agreed period over an agreed area, so you can check the layer against a site visit you were making anyway.
Ahead of renewals
Use the newest layer to decide which licences need a boat and which can be settled from the file.
General notes
Limits
These are the places where the old method still does better, or where this one stops.
Only what shows from above
Structures at or near the surface are traced. Gear that is fully submerged with no float or marker may be missed, and the layer doesn't claim to have it.
Footprint, not contents
The layer shows structure type and area. It can't tell you the species, the stocking or the yield. A site visit does that.
0.5–2 m sets the detail
A pen or raft is several pixels across and can be traced. A single seaweed rope is thinner than a pixel, so seaweed is mapped as the block the lines occupy and not line by line.
Haze, glare and cloud
The near-infrared band is there to help with this. A pass that is still poor is skipped, so a cloudy quarter can leave a gap.
Quarterly is periodic
A pass comes roughly every three months. It isn't continuous watching, and a structure put out and cleared between two passes will not appear.
Seasonal gear
Seaweed lines may be out in one quarter and gone in the next, so a change flag there can be a season and not a change.
Who it's for
Switch if
- You run the licence register for a stretch of coast and can't visit every site each year.
- You want a measured footprint to set against the declared one before a renewal.
- Your GIS already holds the lease boundaries and you want the structures in the same view.
Stick with the boat trip if
- You need to know the species, the stocking or the health of the farm.
- The question is about fully submerged gear, moorings or anything below the surface.
- You need continuous or real-time watching of a site.
FAQ
Questions from licensing teams
Does this replace site inspections?
No. It helps you decide where to send a boat. Inspections still cover species, conditions and anything below the surface.
Can it tell what species is farmed?
No. It maps structure type and footprint only.
How do we check it against our own records?
Pick a few sites you already know, or visit one during the pilot, and set the polygons beside your plotted positions. The layer comes with the date of the pass so you can compare like with like.
What about submerged longlines with no surface marker?
Only structures visible from above are mapped. Fully submerged gear may be missed.
Will turbidity or glare affect it?
Yes. The near-infrared band is there to help, but a poor pass is skipped and not guessed at.
How current is quarterly?
A new pass about every three months. It isn't continuous monitoring.
Who owns the layers, and what about the imagery?
Terms for the delivered layers are written into the contract before work starts. The imagery provider's own licence terms apply to the imagery.
How is it priced?
A pilot is scoped and quoted on the licence area, the length of the pilot and the number of passes. You get a written scope you can take through your procurement.
Send the licence area and we'll tell you what a pilot would cover.
Or .